

An outlier is a data point in a data set that is distant from all other observations. A data point that lies outside the overall distribution of the dataset. Or in a layman term, we can say, an outlier is something that behaves differently from the combination/collection of the data.
Outliers can be very informative about the subject-area and data collection process. It’s essential to understand how outliers occur and whether they might happen again as a normal part of the process or study area. To understand outliers, we need to go through these points:
- what causes the outliers?
- Impact of the outlier
- Methods to Identify outliers
What causes the outliers?
Before dealing with the outliers, one should know what causes them. There are three causes for outliers — data entry/An experiment measurement errors, sampling problems, and natural variation.
- Data entry /An experimental measurement error
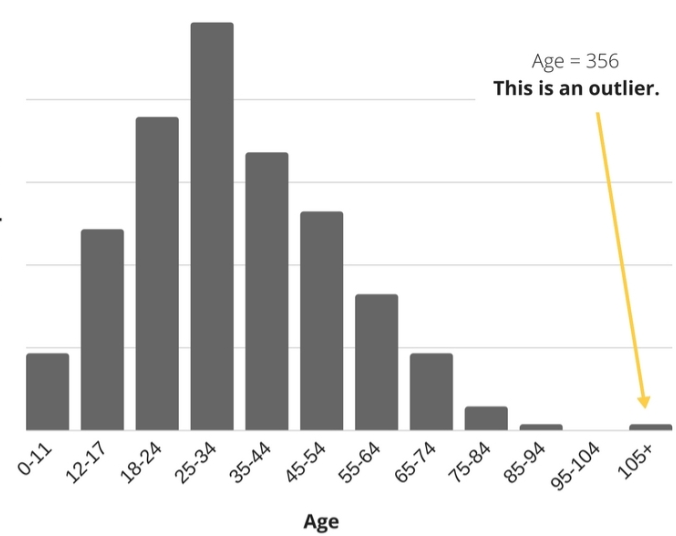
An error can occur while experimenting/entering data. During data entry, a typo can type the wrong value by mistake. Let us consider a dataset of age, where we found a person age is 356, which is impossible. So this is a Data entry error.
These types of errors are easy to identify. If you determine that an outlier value is an error, we can fix this error by deleting the data point because you know it’s an incorrect value.
2. Sampling problems
Outliers can occur while collecting random samples. Let us consider an example where we have records of bone density of various subjects, but there is an unusual growth of bone in a subject, after analyzing this has been discovered that the subject had diabetes, which affects bone health. The goal was to model bone density growth in girls with no health conditions that affect bone growth. Since the data is not a part of the target population so we will not consider this.
3. Natural variation
Suppose we need to check the reliability of a machine. The normal process includes standard materials, manufacturing settings, and conditions. If something unusual happens during a portion of the study, such as a power failure or a machine setting drifting off the standard value, it can affect the products. These abnormal manufacturing conditions can cause outliers by creating products with atypical strength values. Products manufactured under these unusual conditions do not reflect your target population of products from the normal process. Consequently, you can legitimately remove these data points from your dataset.
Impact of the outlier
Outliers can change the results of the data analysis and statistical modeling. Following are some impacts of outliers in the data set:
- It may cause a significant impact on the mean and the standard deviation
- If the outliers are non-randomly distributed, they can decrease normality
- They can bias or influence estimates that may be of substantive interest
- They can also impact the basic assumption of Regression, ANOVA, and other statistical model assumptions.
To understand the impact deeply, let’s take an example to check what happens to a data set with and without outliers in the data set.
Let’s examine what can happen to a data set with outliers. For the sample data set:
1, 1, 2, 2, 2, 2, 3, 3, 3, 4, 4
We find the following mean, median, mode, and standard deviation:
Mean = 2.58
Median = 2.5
Mode = 2
Standard Deviation = 1.08
If we add an outlier to the data set:
1, 1, 2, 2, 2, 2, 3, 3, 3, 4, 4, 400
The new values of our statistics are:
Mean = 35.38
Median = 2.5
Mode = 2
Standard Deviation = 114.74
As you can see, having outliers often has a significant effect on your mean and standard deviation.
Methods to Identify outliers
There are various ways to identify outliers in a dataset, following are some of them:
- Sorting the data
- Using graphical Method
- Using z score
- Using the IQR interquartile range
Sorting the data
Sorting the dataset is the simplest and effective method to check unusual value. Let us consider an example of age dataset:
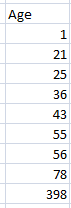
In the above dataset, we have sort the age dataset and get to know that 398 is an outlier. Sorting data method is most effective on the small dataset.
Using graphical Method
We can detect outliers with the help of graphical representation like Scatter plot and Boxplot.
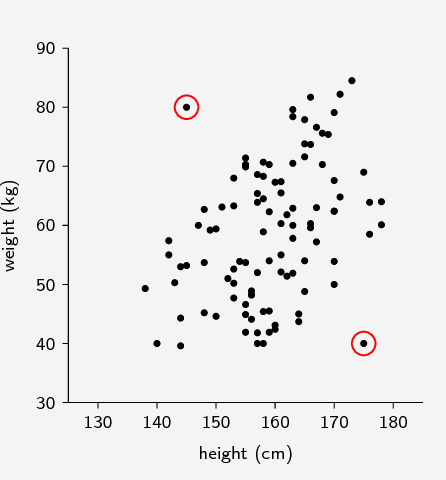
1. Scatter Plot
Scatter plots often have a pattern. We call a data point an outlier if it doesn’t fit the pattern. Here we have a scatter plot of Weight vs height. Notice how two of the points don’t fit the pattern very well. There is no special rule that tells us whether or not a point is an outlier in a scatter plot. When doing more advanced statistics, it may become helpful to invent a precise definition of “outlier”.
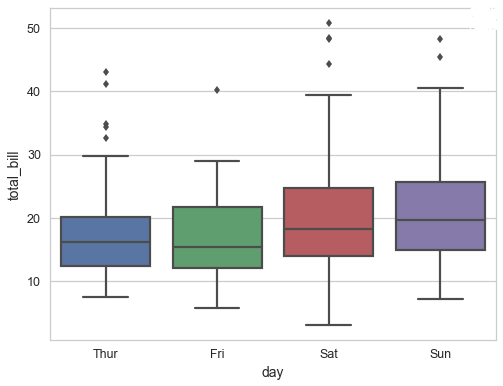
2. Box-Plot
Box-plot is one of the most effective ways of identifying Outliers in a dataset. When reviewing a box plot, an outlier is defined as a data point that is located outside the box of the box plot. As seen in the box plot of bill vs days. Box-Plot uses the Interquartile range(IQR) to detect outliers.
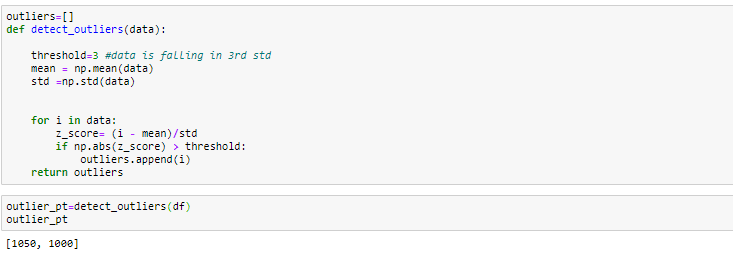
Using z-score

Z-score (also called a standard score) gives you an idea of how many standard deviations away a data point is from the mean.. But more technically it’s a measure of how many standard deviations below or above the population mean a raw score is.
Z score = (x -mean) / std. deviation
In a normal distribution, it is estimated that
68% of the data points lie between +/- 1 standard deviation.
95% of the data points lie between +/- 2 standard deviation.
99.7% of the data points lie between +/- 3 standard deviation.
Formula for Z score = (Observation — Mean)/Standard Deviation
z = (X — μ) / σ
Let us consider a dataset:

Using the IQR interquartile range

Interquartile range(IQR), is just the width of the box in the box-plot which can be used as a measure of how spread out the values are. An outlier is any value that lies more than one and a half times the length of the box from either end of the box.
Steps
- Arrange the data in increasing order
- Calculate first(q1) and third quartile(q3)
- Find interquartile range (q3-q1)
- Find lower bound q1*1.5
- Find upper bound q3*1.5
Anything that lies outside of lower and upper bound is an outlier
Let us take the same example as of Z-score:


As you can see we have found Lower and upper values that is: 7.5 and 19.5, so anything that lies outside these values is an outlier.
This is what Outliers is about.
