

Intro
As data scientists, we often work with tons of data. The data we want to load can be stored in different ways. The most common formats are the CSV files, Excel files, or databases. Also, the data can be available throughout web services. Of course, there are many other formats. To work with the data, we need to represent it in a tabular structure. Anything tabular is arranged in a table with rows and columns.
In some cases, the data is already tabular and it’s easy to load it. In other cases, we work with unstructured data. The unstructured data is not organized in a pre-defined manner (plain text, images, audio, web pages). In this post, we’ll focus on loading data from CSV (Comma Separated Values) files.
Pandas

Pandas is an open source library for the Python programming language developed by Wes McKinney. This library is very efficient and provides easy-to-use data structures and analysis tools.
DataFrame
Pandas contains a fast and efficient object for data manipulation called DataFrame. A commonly used alias for Pandas is pd. The library can load many different formats of data. When our data is clean and structured, every row represents an observation and every column a feature. The rows and the columns can have labels.
In the examples below, I’ll mark some parts with transparent rectangles for a better understanding of what we’re changing. Also, we’ll work with a very small subset from a dataset for simplicity. This dataset contains mobile cellular subscriptions for a given country and year. The full data can be found here. I’ve done some cleaning beforehand to make the data tidy.
Here is the data we want to load into a Pandas DataFrame. It’s uploaded in the in this GitHubGist web app and it’s already visualized with a tabular structure here. However, we can see it the raw format here. Also, we can see that this file contains comma separated values.
To load this data, we can use the pd.read_csv() function.
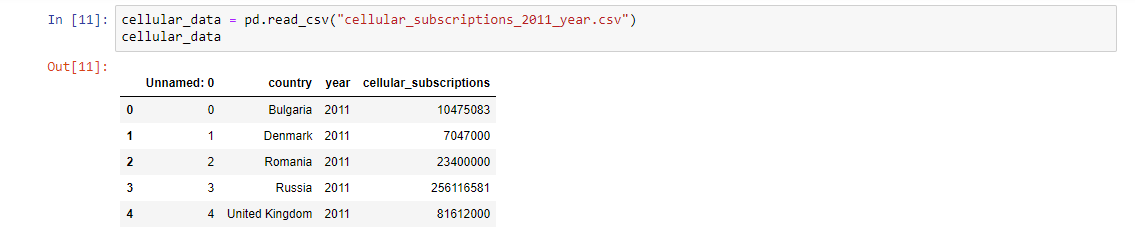
To create these examples, I’m using a Jupyter Notebook. If the last row in a code cell contains value it’s printed. So, that’s why I’ve put the cellular_data variable in the last row of the example.
We can see that the data is loaded, but there is something strange. What is this Unnamed: 0 column? We don’t have such column in our CSV file. Well, in our case this column contains the row labels (row index) of the data and we have to tell Pandas that. We can do this using the index_col argument.

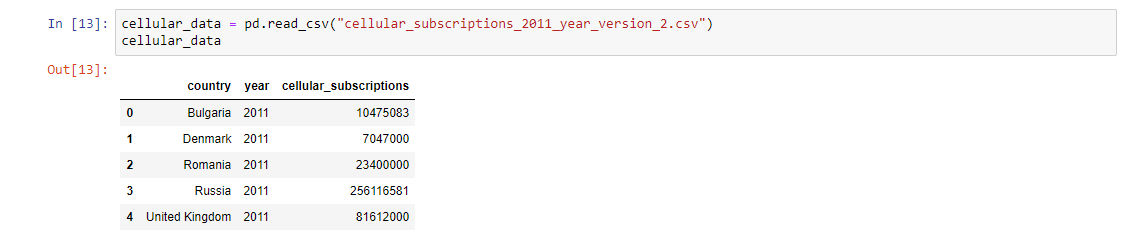
In other cases, our data can be without the row labels. In these cases, pandas will auto-generate these labels starting from 0 to the length of the rows — 1. Let’s see examples with the same data, without the row labels.
Now our DataFrame looks fine. Sometimes, we want to change the row labels in order to work easily with our data later. Here we can set the row labels to be the country code for each row. We can do that by setting the index attribute of a Pandas DataFrame to a list. The length of the list and the length of the rows must be the same. After that, we can easily subset our data or look at a given country using the country codes.

In many cases, we don’t want to set the index manually and we want the index to be one of the columns in the DataFrame. In such cases, we can use the DataFrame object’s method called set_index. Note that pandas doesn’t set the index permanently unless we tell it. In case we want to set the index permanently, we can use the inplace argument to achieve this.
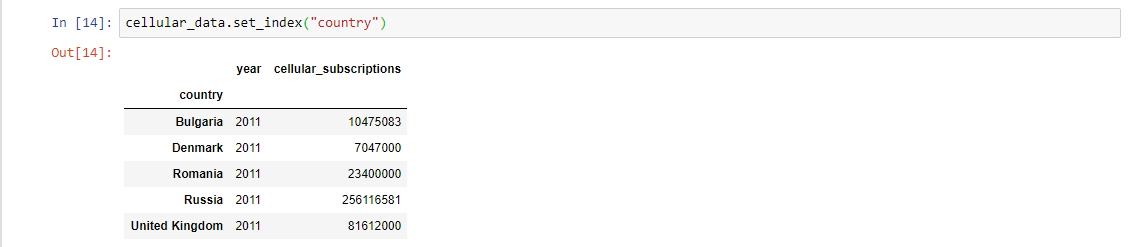

In the example above, we don’t tell pandas to set the index permanently and when we print the cellular_data DataFrame we see that the index is not changed. Let’s try again, with the inplace argument.

Now, we can clearly see that when we use inplace = True, our DataFrame’s index is changed permanently.
Index and Select Data
There are many ways in which you can select data from DataFrames. In this blog post, we’ll see how to use square brackets and the methods loc and iloc to achieve this.
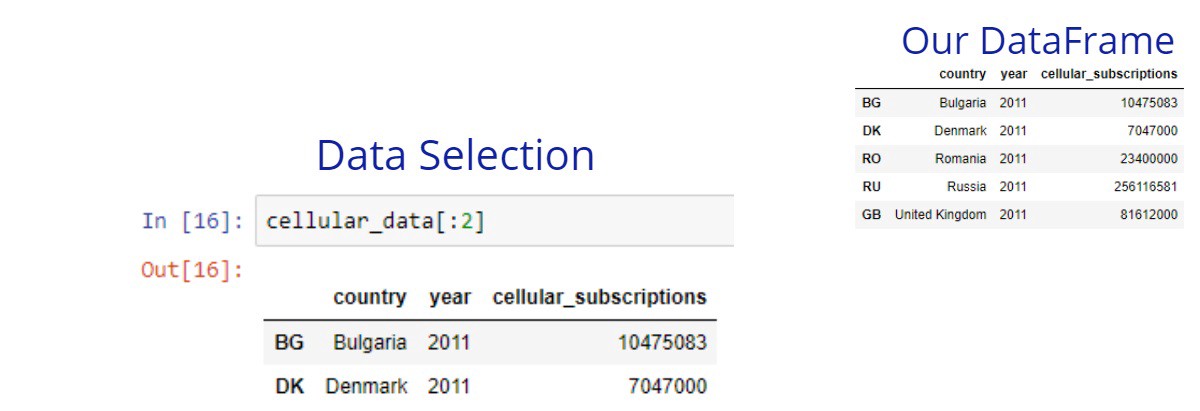
With square brackets, you can select a choice from the rows or you can select a choice from the columns. For a row selection, we can use a list of indexes or a slice. We can select rows using slicing like this: sliceable[start_index:end_index:step]
The end_index is not inclusive. I’ve already written about slicing in one of my previous blog post called Python Basics for Data Science. You can quickly look at the “Subsetting lists” part to understand it. Although the examples there are with lists, the idea here is the same. We just use DataFrames here, they are also sliceable.


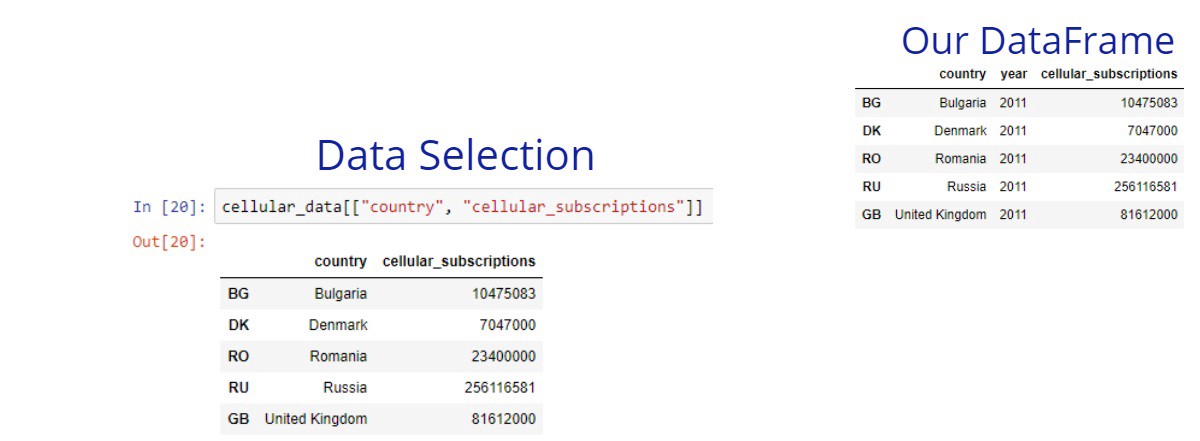
For a column selection, we can use a list of the wanted columns. If we pass only one column as a string instead of a list, the result will be pandas Series. The pandas Series are a one-dimensional array which can be labeled. If we paste 2 or more Series together, we’ll create a DataFrame. In some cases, we might want to select only one column, but keep the data in a DataFrame. In such cases, we can pass a list with one column name.

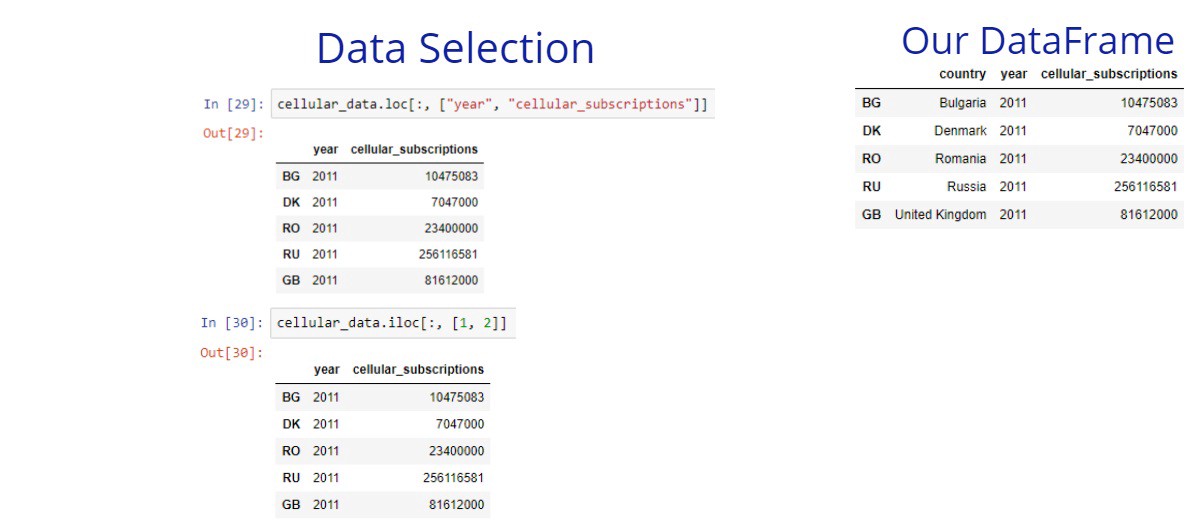
The square brackets are useful, but their functionality is limited. We can select only columns or only rows from a given DataFrame. In many cases, we need to select both columns and rows. The loc and iloc methods give us this power.
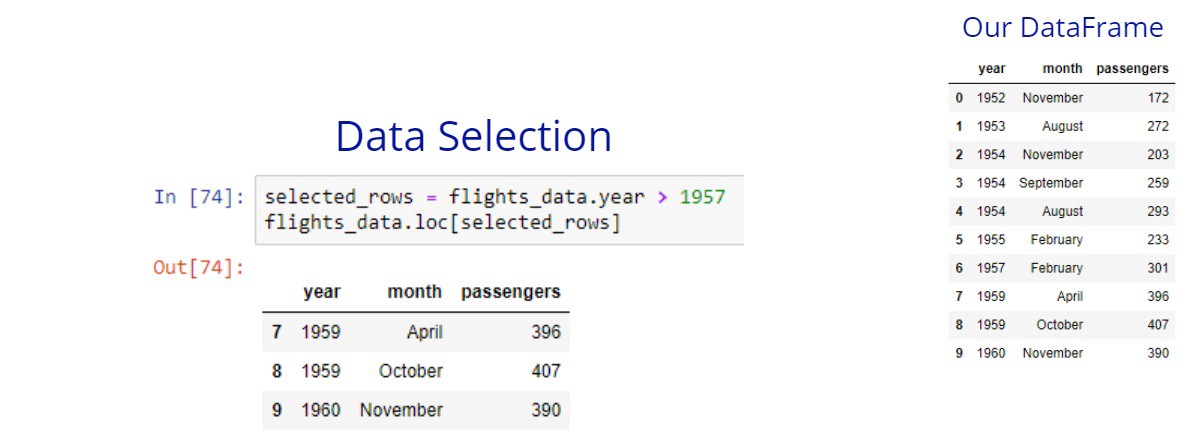
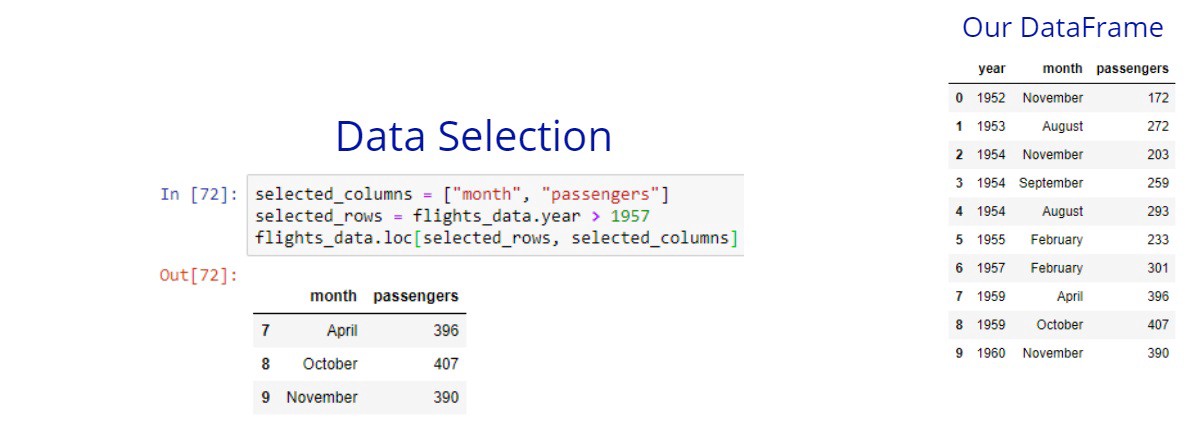
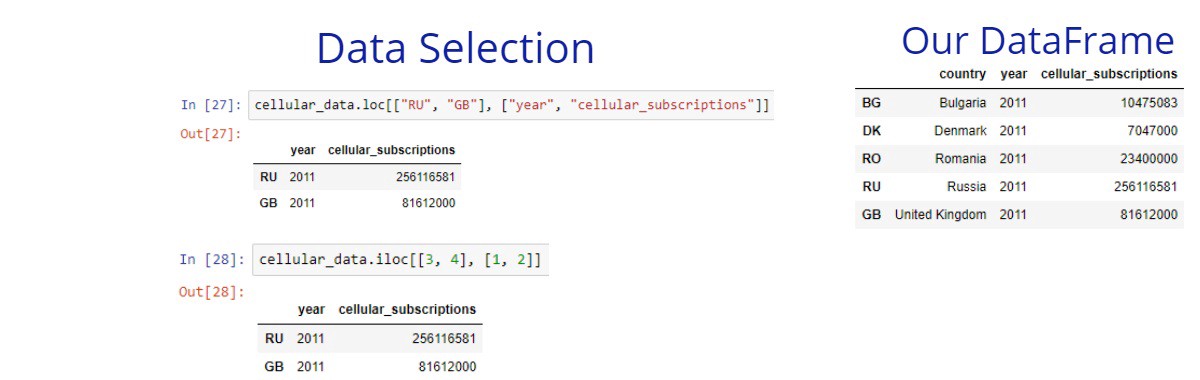
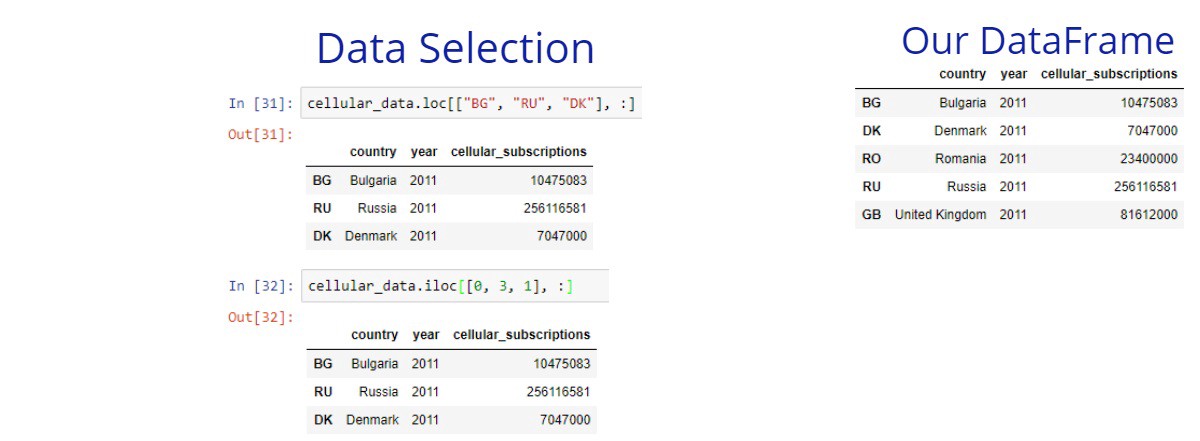
The loc method allows us to select rows and columns of your data based on labels. First, you specify the row labels to the left side, then you specify the column labels to the right side. The iloc allows us the same thing but based on the integer positions of our DataFrame.
If we want to select all rows or columns we can simply type : for the rows or for the columns side. Also if we want to select specific rows but all columns, we can just pass only the rows labels.
Understanding with examples is easier, so let’s see some. In these examples, we’ll compare the usage of these 2 methods.


Comparison operators in Python
The comparison operators can tell us how 2 values relate to each other. In many cases, Python can’t tell us how 2 values of different types relate to each other, but there are some exceptions. For example, we can compare float and integer numbers. Something to keep in mind is that we can compare Booleans with integers. True correspond to 1 and False correspond to 0. These operators are very straightforward.
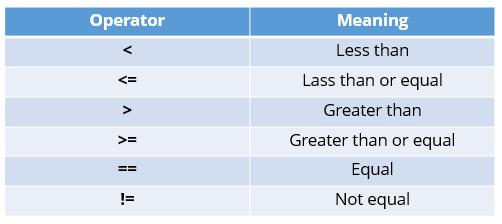
Let’s see some very simple examples.Simple Comparison Operators
Filtering pandas DataFrame
The comparison operators can be used with pandas series. This can help us to filter our data by specific conditions. We can use comparison operators with series, the result will be a boolean series. Each item of these series will be True if the condition is met, and False otherwise. After we have these Boolean series, we can apply a row selection to get a filtered DataFrame as a result.
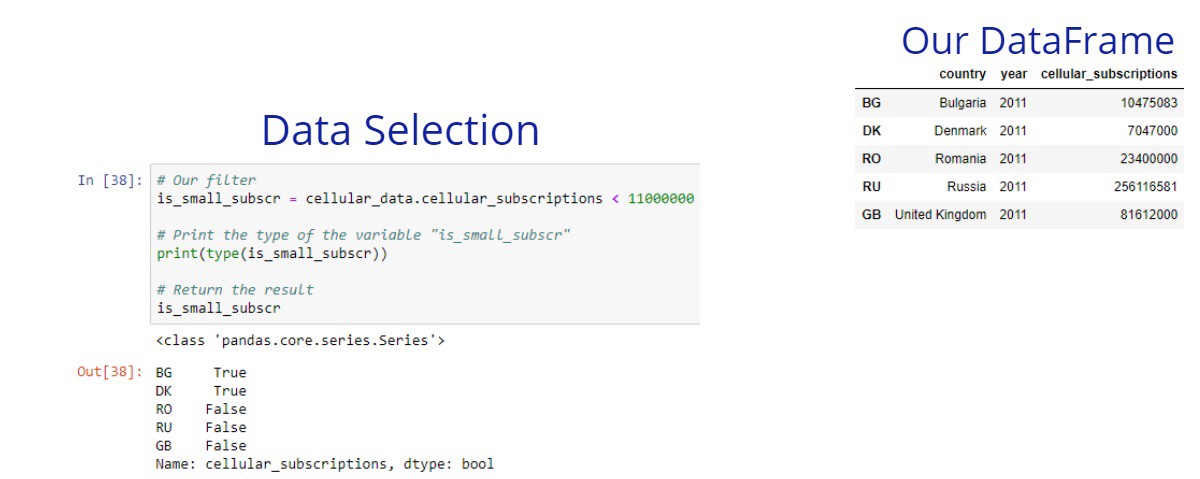
Note that, we’ve used another syntax here to get the cellular_subcription column. DataFrame[column_name] and DataFrame.column_name code blocks returns the same result.
However, be careful with the dot syntax (used in these examples), because your column can be with the same name of the DataFrame’s methods. For example, if we have a column called “min”, we can’t use the dot syntax to get the values from that column. That’s because the DataFrame object has a method called “min”. Let’s now see how we can use the Boolean Series from above to filter our DataFrame.

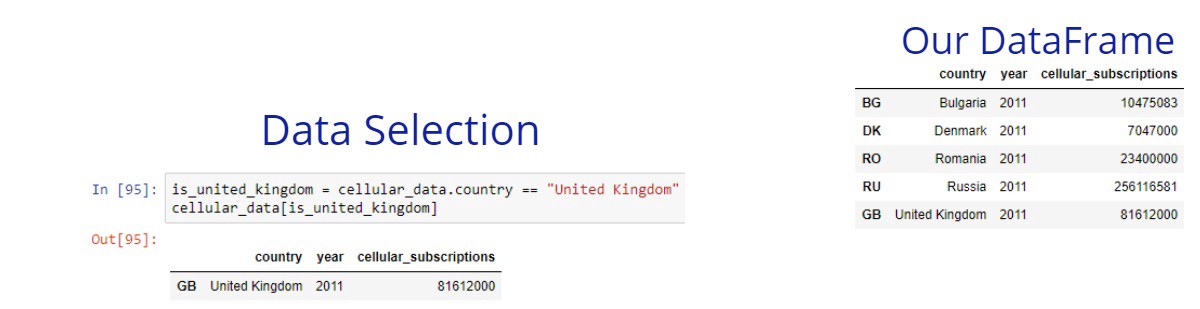
Let’s see another example. Imagine that we want to get all records where the country is the United Kingdom.
Boolean Operators
Now that we know how to generate a Boolean series that meets some conditions, we can now use Boolean operators on them to create more complex filtering.
There are 3 types of Boolean operations
- and – takes 2 Boolean values and return
Trueif both the values areTrue. This operator is a short-circuit, it only evaluates the second argument if the first one isTrue. - or – takes 2 Boolean values and return
Trueif at least one of them isTrue. This operator is also a short-circuit, it only evaluates the second argument if the first one isFalse. - not – take a Boolean value and return the opposite. This operator has a low priority than non-Boolean operators. For example
not x == yis interpreted asnot (x == y)andx == not yis a syntax error. Also, it is commonly used when we need to combine different Boolean operations and then want to negate the result.
Simple Boolean Operations
Subsetting by Multiple Conditions
When we want to filter our DataFrame by multiple conditions, we can use the Boolean operators. An important note here is that when we want to use Boolean operators with pandas, we must use them as follows:
&for and|for or~for not
When we apply a Boolean operation on 2 Boolean series with the same size, the Boolean operation will apply for each pair.
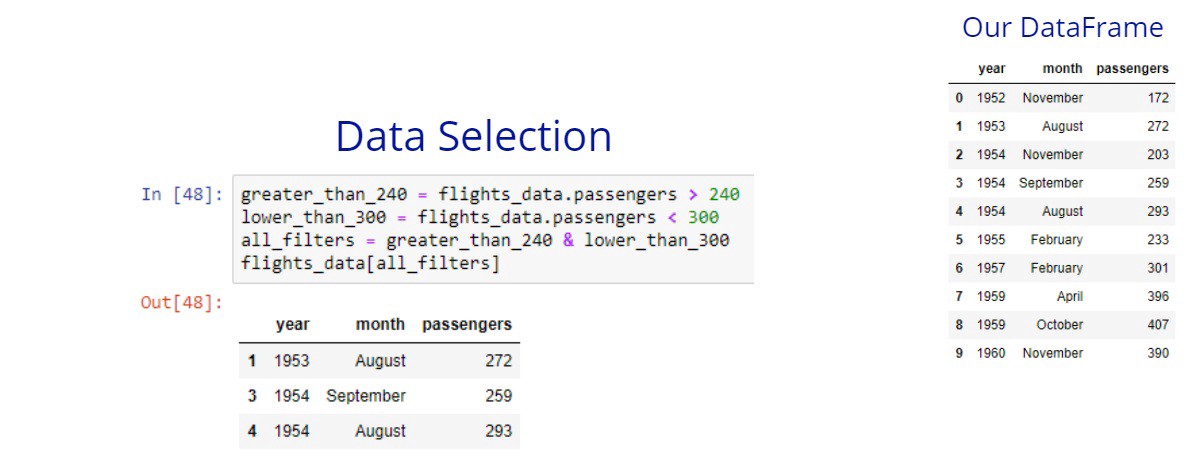
Using the “and” operator
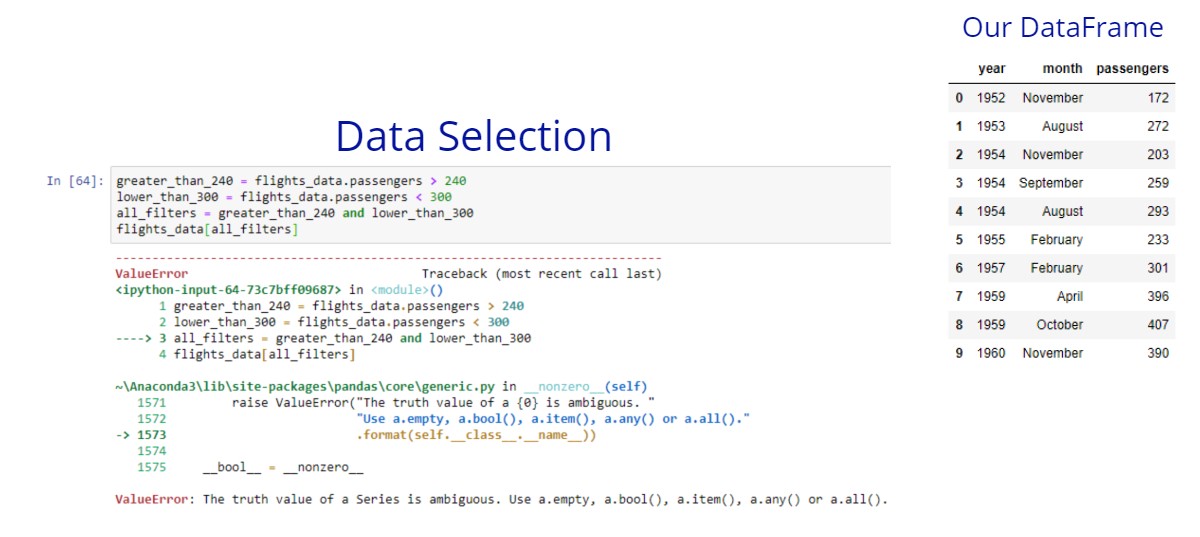
We can see that pandas doesn’t work with and operator, it expects the & operator. Now, let’s try again. The goal here is to get only the flights that have more than 240 passengers and less than 300 passengers.
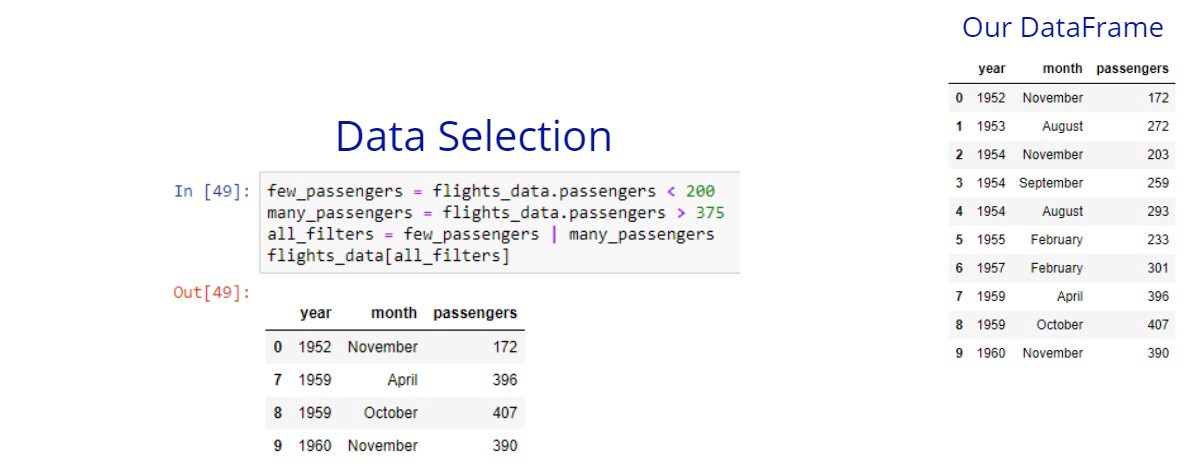
Using the “or” operator
Let’s find all flights that have lower than 200 or greater than 375 passengers. Remember that for the or operator we use the pipe | character.
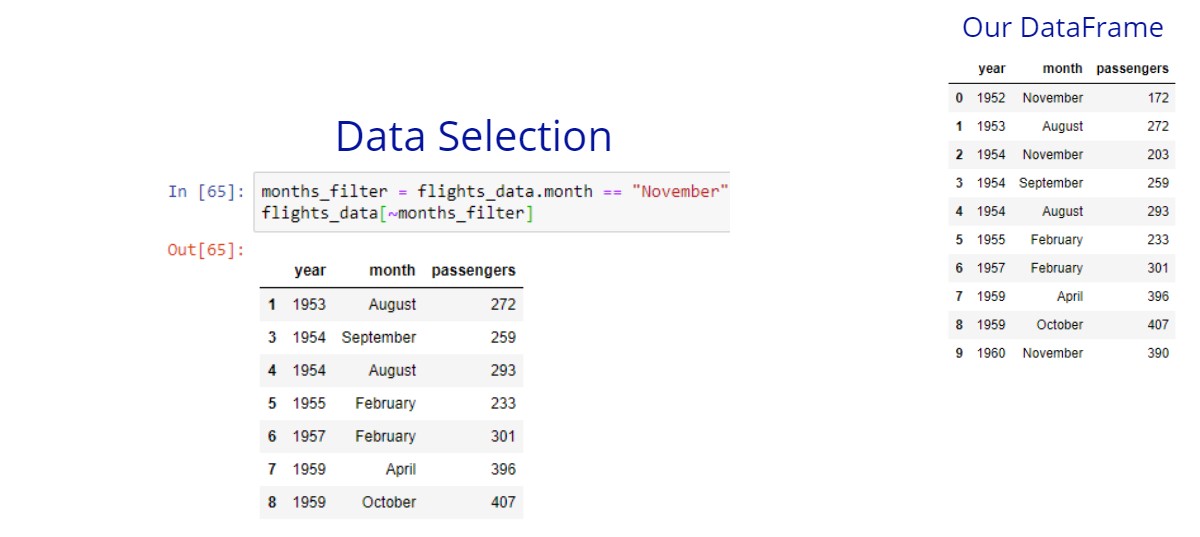
Reversing conditions using the not operator
In some cases, we want to negate our condition. In such cases, we can use the not operator. For this operator, we use the tilde ~ character.
Let’s say that we want to get all flights that the month is not November.
Complex Conditions
We can make a more complex filtering based very specific conditions.
Let’s get all flights that in November for the 1952 and 1954 years.

Now, let’s get all flights that are between the 1952 and 1954 years and the month is August or September.

The isin method
Imagine that we want to compare equality of a single column to multiple values. Let’s say that we want to get all flights that are in the months: February, August, and September. One way to achieve this is with multiple or conditions like this.

There is a repeated code and this is tedious. There is a better way to achieve the same result by using the isin method. We need to pass as a list or set the values to this method and it will return the wanted Boolean series.

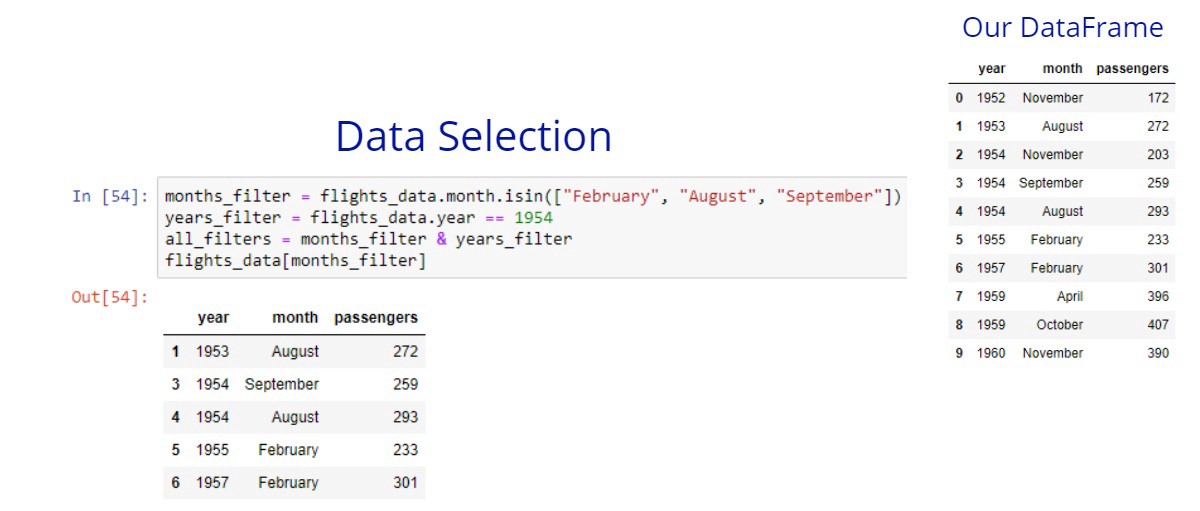
Of course, we can combine the returned Boolean series of this method with other Boolean series.
Let’s say that we want to get the flights that are in the 1954 year and in the February, August, and September months.
The between method
This method can make our code cleaner when we want to select values inside in a range. Instead of writing 2 Boolean conditions, we can use this method.
Let’s say that we want to get all flights between the 1955 and 1960 years inclusive.


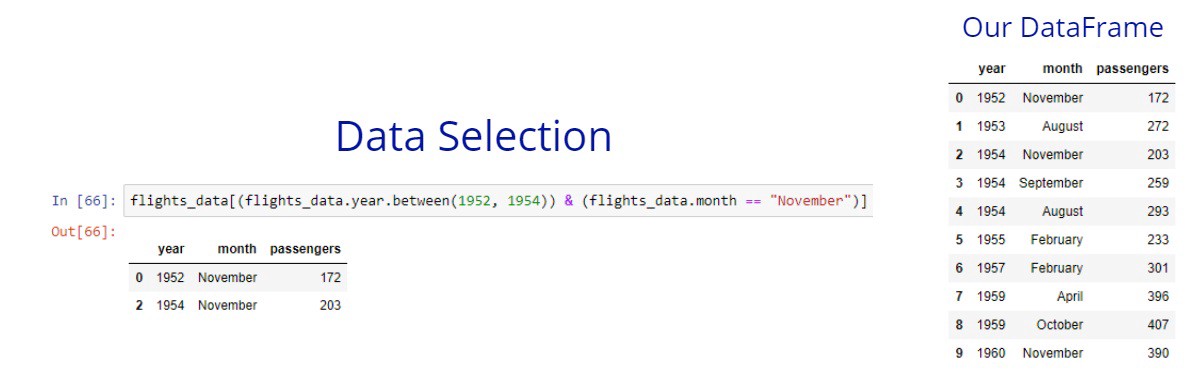
Again, we can combine this method with another conditional filtering.
Let’s get all the flights that are between the 1955 and 1960 years and are in the October month.

The isnull and isna methods
This isna method indicates whether values are missing (NaN in numeric arrays, None or NaN in object arrays, NaT in datetimelike). The isnull method is an alias for the isna method. This means that these 2 methods are exactly the same, but with different names.
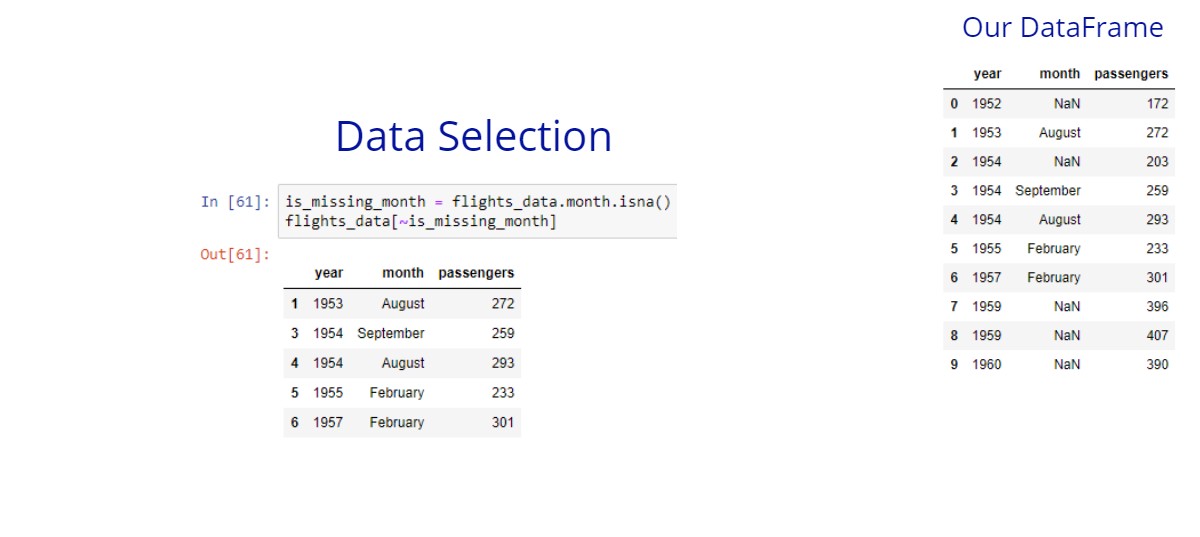
I’ve changed the flights DataFrame which we have used. There are some NaN values in the month column. Let’s see how we can get all the records which have a missing month.


In many cases, we want to get the data that have no missing values. Let’s try to get the flights that have no missing month. We can use the not operator with the ~ character to negate the Boolean series returned by the isna method.
The notna method
There is also a method called notna. This method is the opposite of the isna method. We can achieve the same result from the last example using this method.

Subsetting by a Condition in One Line
All the examples we look at for now can be written in one line. Some people like that, others hate it. When we’re subsetting by only one condition in many cases it’s more preferable and easy to write our filter in one line.
Let’s first see a subsetting example only with one condition.

Subsetting by Multiple Conditions in One Line
In some cases, it’s okay to write a simple expression in one line, but in other cases, it’s very unreadable. My suggestion here is to write the simple ones in one line and the complex ones in multiple lines. If your row is very long it can be unreadable, so be careful.


Subsetting with boolean series using the .loc method.
Remember the .loc method? We can select rows and columns based on labels with this method. The nice thing is that we can pass Boolean series instead of passing labels for a rows or columns selection and it will work.
All of the generated Boolean series of the examples above we used for subsetting can be passed for a row selection.