

Data Analysis is a process of inspecting, cleaning, transforming and modeling data with the goal of discovering useful information, suggesting conclusions and supporting decision-making
.
Types of Data Analysis
Several data analysis techniques exist encompassing various domains such as business, science, social science, etc. with a variety of names. The major data analysis approaches are −
Data Mining
Business Intelligence
Statistical Analysis
Predictive Analytics
Text Analytics
Data Mining
Data Mining is the analysis of large quantities of data to extract previously unknown, interesting patterns of data, unusual data and the dependencies. Note that the goal is the extraction of patterns and knowledge from large amounts of data and not the extraction of data itself.
Data mining analysis involves computer science methods at the intersection of the artificial intelligence, machine learning, statistics, and database systems.
The patterns obtained from data mining can be considered as a summary of the input data that can be used in further analysis or to obtain more accurate prediction results by a decision support system.
Business Intelligence
Business Intelligence techniques and tools are for acquisition and transformation of large amounts of unstructured business data to help identify, develop and create new strategic business opportunities.
The goal of business intelligence is to allow easy interpretation of large volumes of data to identify new opportunities. It helps in implementing an effective strategy based on insights that can provide businesses with a competitive market-advantage and long-term stability.
Statistical Analysis
Statistics is the study of collection, analysis, interpretation, presentation, and organization of data.
In data analysis, two main statistical methodologies are used −
Descriptive statistics − In descriptive statistics, data from the entire population or a sample is summarized with numerical descriptors such as −
Mean, Standard Deviation for Continuous Data
Frequency, Percentage for Categorical Data
Inferential statistics − It uses patterns in the sample data to draw inferences about the represented population or accounting for randomness. These inferences can be −
answering yes/no questions about the data (hypothesis testing)
estimating numerical characteristics of the data (estimation)
describing associations within the data (correlation)
modeling relationships within the data (E.g. regression analysis)
Predictive Analytics
Predictive Analytics use statistical models to analyze current and historical data for forecasting (predictions) about future or otherwise unknown events. In business, predictive analytics is used to identify risks and opportunities that aid in decision-making.
Text Analytics
Text Analytics, also referred to as Text Mining or as Text Data Mining is the process of deriving high-quality information from text. Text mining usually involves the process of structuring the input text, deriving patterns within the structured data using means such as statistical pattern learning, and finally evaluation and interpretation of the output.
Data Analysis Process
Data Analysis is defined by the statistician John Tukey in 1961 as “Procedures for analyzing data, techniques for interpreting the results of such procedures, ways of planning the gathering of data to make its analysis easier, more precise or more accurate, and all the machinery and results of (mathematical) statistics which apply to analyzing data.”
Thus, data analysis is a process for obtaining large, unstructured data from various sources and converting it into information that is useful for −
Answering questions
Test hypotheses
Decision-making
Disproving theories
Data Analysis with Excel
Microsoft Excel provides several means and ways to analyze and interpret data. The data can be from various sources. The data can be converted and formatted in several ways. It can be analyzed with the relevant Excel commands, functions and tools – encompassing Conditional Formatting, Ranges, Tables, Text functions, Date functions, Time functions, Financial functions, Subtotals, Quick Analysis, Formula Auditing, Inquire Tool, What-if Analysis, Solvers, Data Model, PowerPivot, PowerView, PowerMap, etc.
Data Analysis is a process of collecting, transforming, cleaning, and modeling data with the goal of discovering the required information. The results so obtained are communicated, suggesting conclusions, and supporting decision-making. Data visualization is at times used to portray the data for the ease of discovering the useful patterns in the data. The terms Data Modeling and Data Analysis mean the same.
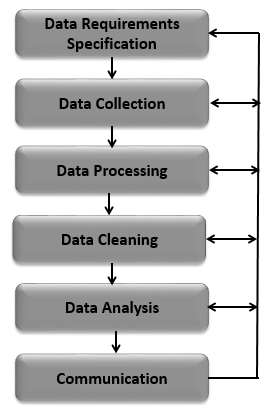
Data Analysis Process consists of the following phases that are iterative in nature −
- Data Requirements Specification
- Data Collection
- Data Processing
- Data Cleaning
- Data Analysis
- Communication
Data Requirements Specification
The data required for analysis is based on a question or an experiment. Based on the requirements of those directing the analysis, the data necessary as inputs to the analysis is identified (e.g., Population of people). Specific variables regarding a population (e.g., Age and Income) may be specified and obtained. Data may be numerical or categorical.
Data Collection
Data Collection is the process of gathering information on targeted variables identified as data requirements. The emphasis is on ensuring accurate and honest collection of data. Data Collection ensures that data gathered is accurate such that the related decisions are valid. Data Collection provides both a baseline to measure and a target to improve.
Data is collected from various sources ranging from organizational databases to the information in web pages. The data thus obtained, may not be structured and may contain irrelevant information. Hence, the collected data is required to be subjected to Data Processing and Data Cleaning.
Data Processing
The data that is collected must be processed or organized for analysis. This includes structuring the data as required for the relevant Analysis Tools. For example, the data might have to be placed into rows and columns in a table within a Spreadsheet or Statistical Application. A Data Model might have to be created.
Data Cleaning
The processed and organized data may be incomplete, contain duplicates, or contain errors. Data Cleaning is the process of preventing and correcting these errors. There are several types of Data Cleaning that depend on the type of data. For example, while cleaning the financial data, certain totals might be compared against reliable published numbers or defined thresholds. Likewise, quantitative data methods can be used for outlier detection that would be subsequently excluded in analysis.
Data Analysis
Data that is processed, organized and cleaned would be ready for the analysis. Various data analysis techniques are available to understand, interpret, and derive conclusions based on the requirements. Data Visualization may also be used to examine the data in graphical format, to obtain additional insight regarding the messages within the data.
Statistical Data Models such as Correlation, Regression Analysis can be used to identify the relations among the data variables. These models that are descriptive of the data are helpful in simplifying analysis and communicate results.
The process might require additional Data Cleaning or additional Data Collection, and hence these activities are iterative in nature.
Communication
The results of the data analysis are to be reported in a format as required by the users to support their decisions and further action. The feedback from the users might result in additional analysis.
The data analysts can choose data visualization techniques, such as tables and charts, which help in communicating the message clearly and efficiently to the users. The analysis tools provide facility to highlight the required information with color codes and formatting in tables and charts.
